
NFL Advanced Coverage heat maps
An advanced view on defensive coverage quality


Introduction
In this article, I will discuss NFL Advanced Coverage heat maps, which are designed to provide an in-depth look at how well defenses cover specific areas of the field and the efficiency allowed in different places when targeted. I will also explain the two metrics featured in these heat maps — Completion Percentage Over Expected (CPOE) and Expected Points Added (EPA) — and what they mean from the defense’s perspective.
This idea builds off my last article, QB heat maps, which gives an in-depth look at a QB’s accuracy and efficiency when targeting certain areas on the field. You can check out that article here:
Completion Percentage Over Expected (CPOE) and Expected Points Added (EPA) Review and defense perspective.
Completion Percentage Over Expected(CPOE) is an advanced stat that measures a passer’s accuracy by comparing their actual completion percentage to the expected completion percentage, which is based on various factors such as:
Pass Depth(Air Yards)
Receiver Separation
Down, Distance, and Field Position
Defender Pressure
From the defensive perspective, CPOE tells us how difficult the defense is making throws for the opposing quarterback.
Expected Points Added (EPA) is a football metric that measures how much a single play increases or decreases a team’s expected point total. It is based on an expected points model, which estimates how many points a team is likely to score from a specific game situation using factors such as down, distance, field position, and time remaining.
EPA for a given play is calculated as:
EPA = Expected Points After the Play − Expected Points Before the Play
A positive EPA indicates an efficient, beneficial play (it improved the team’s scoring outlook), while a negative EPA means the play reduced the team’s expected points.
When viewing EPA on the coverage heat maps, viewing overall efficiency, this includes efficiency from the throw and after the catch.
Coverage heat maps
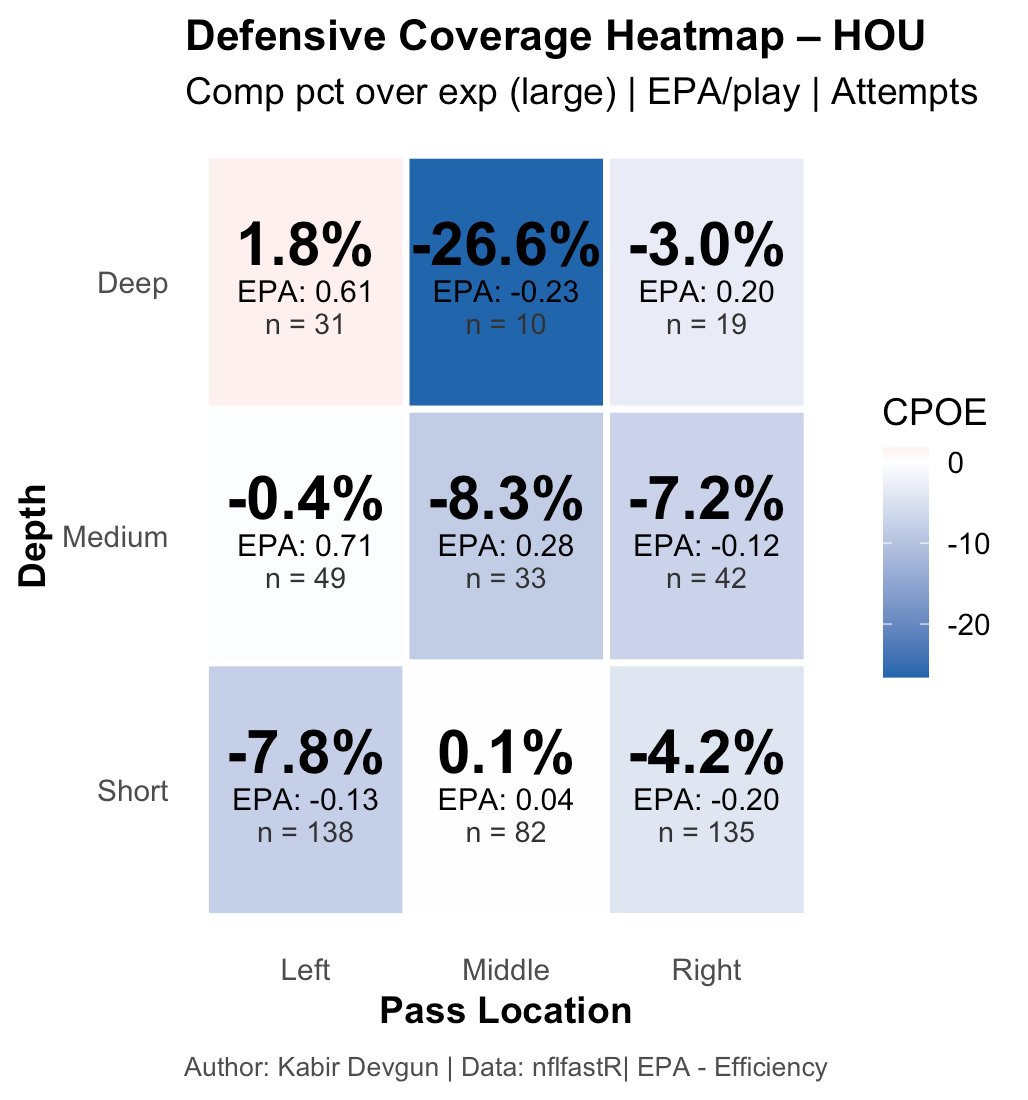
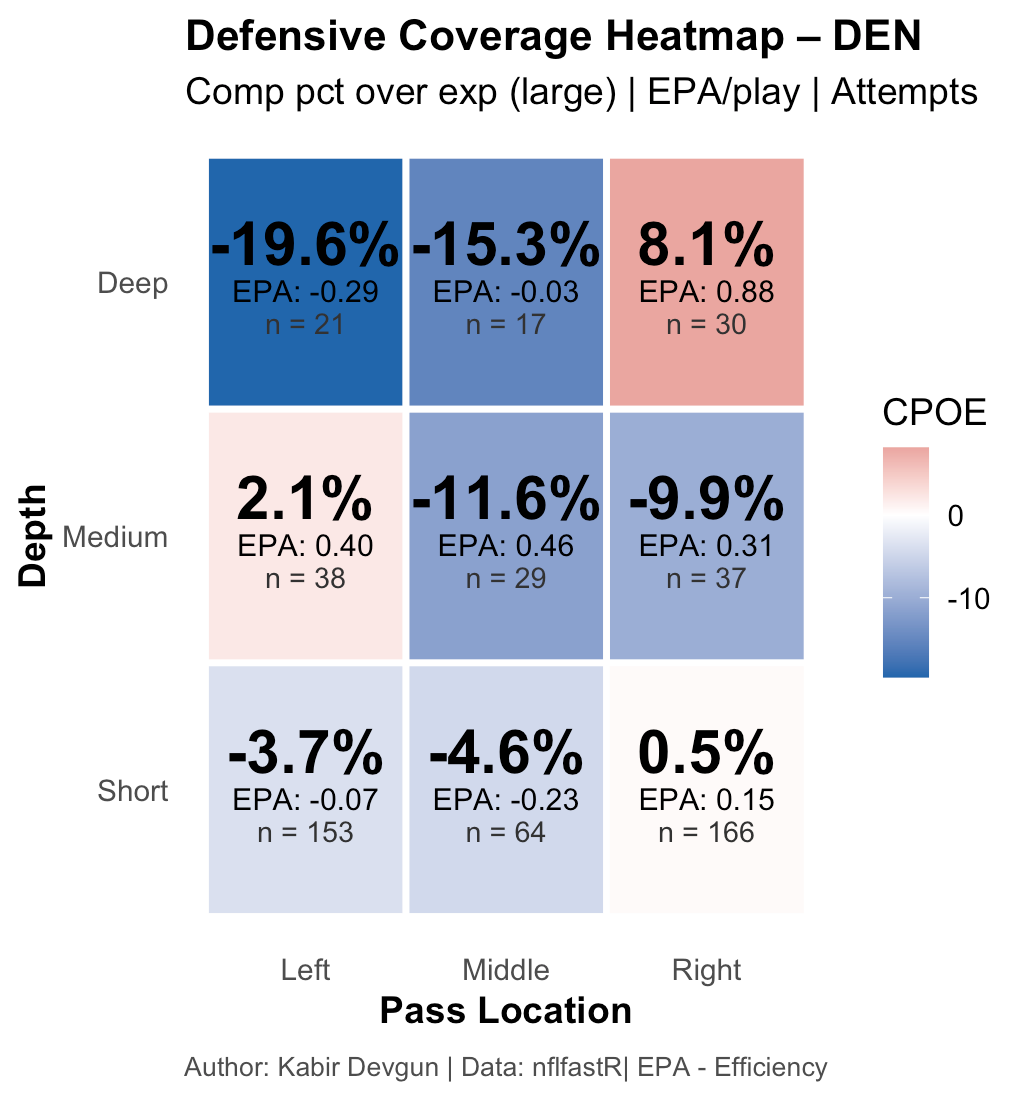
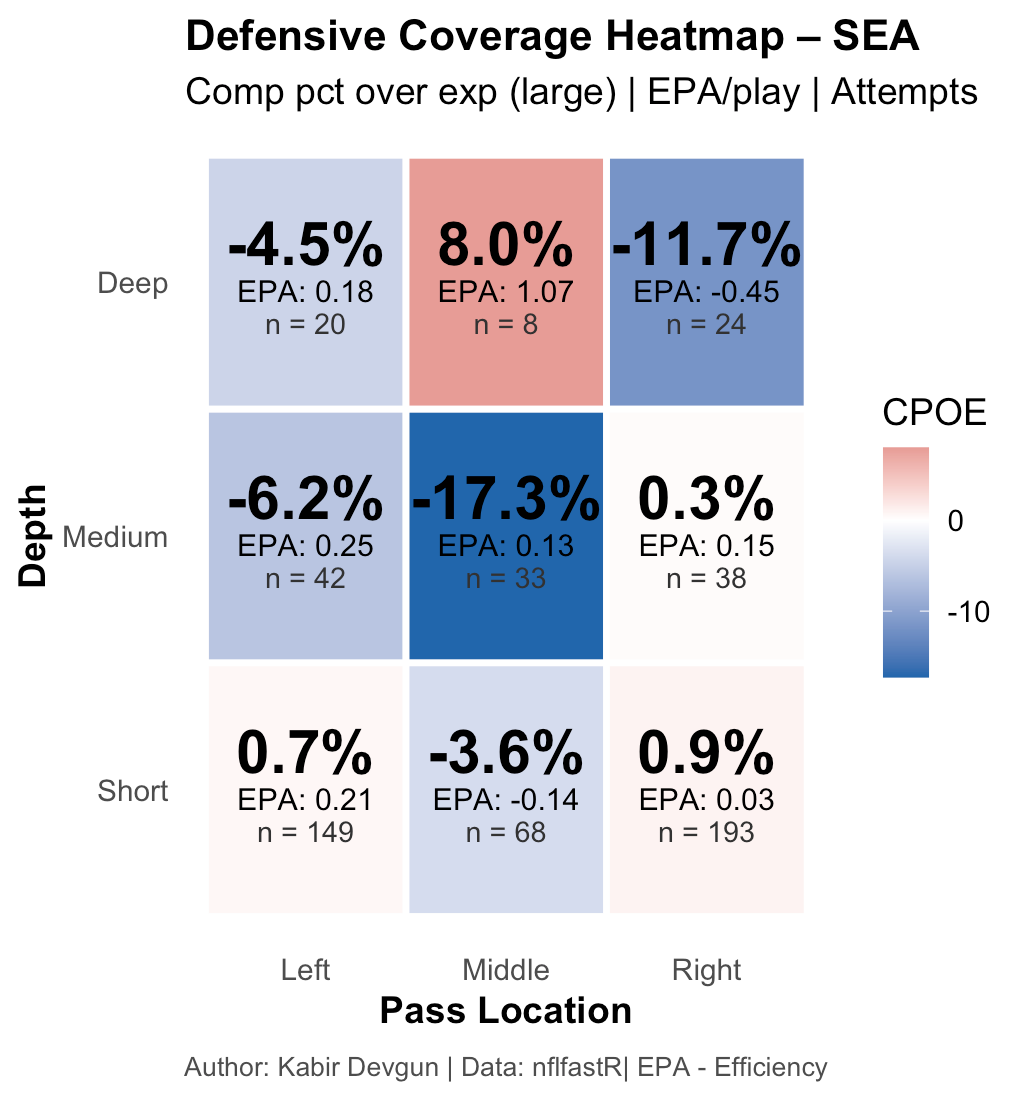
The charts above are advanced coverage heat maps for certain defenses. Just like the quarterback version, each heat map is divided into nine zones based on two factors: pass location and pass depth. The location categories are Left, Middle, and Right, while the depth categories are Short, Medium, and Deep. Pass depth is defined by air yards as follows:
Short: 10 or fewer air yards
Medium: 11–20 air yards
Deep: 21 or more air yards
Each zone displays the CPOE and EPA/play allowed when targeted in that specific area of the field, along with the number of pass attempts in that zone to provide context, since small sample sizes can influence some zones.
Conclusion
Defensive heat maps are designed to provide a deeper and more precise view of how well a defense defends certain areas of the field.
If you’d like to see a specific team’s advanced heat map, feel free to reply to the article post on my Twitter, which will be linked below.
Thanks for reading, and follow for more:
https://x.com/Kdevgun28
https://x.com/Intellectsp